Loudspeaker Thiele/Small
Parameter Extraction
Here we extract basic free air
Theile/Small parameters from the complex impedance curve of a 10” low
frequency driver. These parameters may be used to verify the
manufacturers published specifications and provide the basis for
enclosure design.
Two external resistors are required to
perform this measurement. First a resistor (R1), to establish a constant
current in the circuit is required. The precision and value of this resistor
is not critical. However, if it is too low (< 30Ω), its purpose
is defeated and if it is too high (> 5kΩ) noise immunity of the
circuit will be compromised. Secondly a precision reference
resistor (R2), whose value is known to two decimal points, is required.
This provides the software with a known reference so that it can
accurately plot the absolute value of the driver impedance in the
spectrum analyzer.
We will use "32768_MLS_Impedance_Measurement.process"
to perform the measurement. This process ships with the release version
of this product. It consists of four modules. The first is the signal
generator, which generates a 32768 length MLS stimulus to excite the DUT.
Second is the SoundIO module, which plays the stimulus and records the
response of the driver. Third is the Oscilloscope module, which allows us
to view the time domain response of the driver. Finally is the Spectrum
Analyzer, which performs an FHT/ FFT on the time domain data and allows
us to view impedance vs. frequency and phase vs. frequency graphs.
You must have a dual channel, duplex
sound card to perform this measurement.
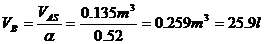
1. Measure the value of the reference
resistor using a precision ohmmeter or DC resistance bridge. Our
reference measures in at 10.067Ω.
2. Measure the DC resistance of the
drivers voice coil (RE) to the nearest 0.1Ω. Use a
precision ohmmeter or bridge. Our voice coil measures in at 6.89Ω.
This application cannot measure the DC resistance of the drivers voice
coil directly. This is due to the fact that most sound cards are AC
coupled, that is they have a capacitor between their internal amplifier
and their output jack, and thus do not pass DC current. Driver voice coil
resistance can be measured using very low frequency sine waves (< 1Hz)
and a series precision resistance but most sound cards cannot reliably
reproduce such frequencies. If you have a 1.5 volt battery and voltmeter
available you can wire the loudspeaker and the precision resistor in
series across the battery terminals and calculate the voice coil
resistance using the following equations.


3. Suspend the driver vertically about
half way between the ceiling and the floor using a piece of wire or
twine. Do not place the driver horizontally on a table or other
reflective surface. This will result in cone pre-loading that will cause
errors. Reflections from any nearby surface will cause response ripples
in the impedance curve.
4. Wire the circuit as shown in Figure
1. Use short, low resistance or shielded wiring. Note that many
sound cards speaker outputs have more swing than their respective line
inputs.

Figure 1: Thiele/Small Extraction Process Calibration Wiring
5. If you are running Windows 7 or 8 or
Vista you must disable all sound effects applied to your sound card.
Right click the sound icon on the windows task bar and select Playback
devices from the popup menu that appears. Select the sound card you
intend to use from the "Select a playback device below to modify its
settings" listbox and press the Properties button. Select the
Enhancements tab and check the Disable all Sound effects
checkbox. Press the OK button.

Figure 2: Windows 7/Vista Playback Enhancements Disabled
6. Open " C:\Users\Public\Documents\Sonic
Beacon\Sonic Beacon\32768_MLS_Impedance_Measurement.process"
from the applications File…Open… menu. Press OK if the
“No Compatible Calibration File Present” message box appears.
7. Open the FFT Options dialog from
the applications Options…FFT… menu and ensure the FFT Size
is 32768. Press OK in the FFT Options dialog box. Press OK
when the “No Compatible Calibration File Present” message box
appears.
8. You need to adjust the level of your
selected sound card recording path. If you are running Windows 7 or 8 or
Vista right click the sound icon on the windows task bar and select Recording
devices from the popup menu that appears. Double click the selected
sound card in the Sound dialog box Recording tab. Select the Levels
tab and adjust the slider to its one-quarter setting. Press the OK
button. If you are running XP or below; select the Levels tab
Press the Open Mixer button the SoundIO modules Options
group. Select Options… Properties… Choose your sound card from the
Mixer Device and press the Recording radio button in the Adjust
Volume for group. Press the OK button. Deselect all Record
Control mixer paths except the Line In. Adjust the Line In
mixer slider to its one-quarter setting and equalize its balance slider.
9. You
need to adjust the output level of your selected sound cards playback
path. If you are running Windows 7 or 8 or Vista select the Playback
tab of the Sound dialog box and double click the selected sound card.
Select the Levels tab and adjust the Line In to its 25% setting. Otherwise
if you are using XP or lower select Options… Properties… Press the
Playback radio button in the Adjust Volume for group. Press
the OK button. Mute all Playback mixer gain settings except
the Volume Control and the Wave Out. Equalize the Volume
Control and the Wave Out mixer balance sliders. Adjust the Volume
Control and the Wave mixer sliders to their one-quarter
settings.
10. Press the applications Run button. You
should be able to see the MLS sequence in the oscilloscope module as
shown in Figure 3. If a SoundIO “No data in record buffer” message
appears first check that your wiring conforms to Figure 1. If it is
correct, increase the mixers Playback Volume Control and Wave
Out sliders or Recording Line controls.
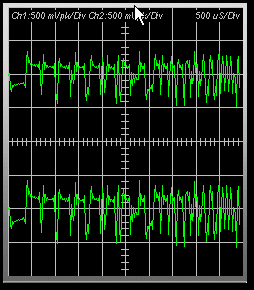
Figure 3: Thiele/Small Extraction Process MLS Sequence Setup
11. If all three controls are at maximum you may
reduce the level at which the sound card triggers. When in Record/Play
mode, the SoundIO module sends a record buffer to the sound card that
is 1.4 longer than required. This is to compensate for various system
delays. It then scans the buffer for the first level that is greater than
the trigger level. It then marks this point as the beginning of the
record and returns the remainder of the record (up to the number of
samples required for the selected FFT size) to the application. This is
the record that the modules processes and sends to subsequent modules.
Trigger level is expressed in terms of percentage full scale. Check the
value in the Trig. Level (%F.S.) in the SoundIO Trigger
Parameters group. If it is greater than 20 select 10 in
the combo box. Press the Run button and check the oscilloscope
display again. You can reduce this value to as low as 1%. This
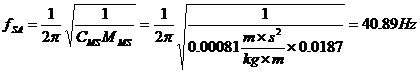
corresponds to 1% of the sound card full-scale output. You can estimate
the length of the buffer that is sent to the sound card for a given FFT
Size from the equation below.

If
you know the full scale output voltage of your sound card, you can
estimate the level that causes the SoundIO module to trigger from the equation
below. Sound cards have a typical input swing ranging from +0.5 to
+2.0 volts.

Once
you have a valid trigger, adjust the Play Control and the Wave
sliders so that the signal in the oscilloscope display is not clipped (as
in Figure 3).
13. You now need to calibrate the frequency response
curve of the sound card if you do not already have a valid calibration
file loaded for the input and output devices selected in the SoundIO
module. Level and Latency calibration are not required for complex
impedance measurement. Press the Calibration button in the SoundIO
module. The SoundIO Module Calibration dialog box will open..
14. Select Frequency from the Calibration
Type Select: combo box in the Calibration Status group box.
Select MLS from the Signal Type combo box in the Frequency
Calibration group box.
15. Press the Run button and wait for the Frequency
Calibration Complete status message to appear. If a “No data in
record buffer” message box appears Press the Open Mixer button
and increase the applications output level slider. The SoundIO modules
input device level may also be increased by right clicking on the Windows
Task Bar Sound icon and selecting the Recording and Levels
and adjusting the devices slider. Frequency calibration may be restarted by
pressing the Run button. If successful, the calibration dialog should
look as in Figure 4. The Calibration Progress bar may not update in
certain versions of Windows.

Figure 4: Thiele/Small Extraction Process Calibration Dialog
after Auto Calibration
17. Now rewire the circuit as shown in Figure 5.

Figure 5: Thiele/Small Extraction Process Test Wiring
18. Change the Spectrum Analyzers XAxis Selection to Log10.
Set the Stop Frequency to 689Hz using the Stop: Dn button
in the XAxis group. Change the Y-Axis Selection and scale to |Z|
and 10 ohms/div respectively. Enter the exact value of the
reference resistor wired between Ch1 Line-In and Ch2 Line-In in the Ref1:
edit box in the spectrum analyzer. Check the Apply Freq Cal
checkbox. Change the Averaging factor to 4 in the Avg:
combo box of in the spectrum analyzer. This will help smooth the low
frequency results.

Figure 6: Thiele/Small Extraction Process Spectrum Analyzer
Module Settings
19. Press the Run button on the application
toolbar and observe the trace in the spectrum analyzer. The impedance and
phase appear in channels one and two respectively.

Figure 7: Thiele/Small Extraction Process Spectrum Analyzer Module
With Driver Impedance and Phase Plots
20. Find the maximum impedance in the spectrum
analyzer and record it (Rmax) and the frequency at which it
occurred (fSA). Pressing the right mouse button and dragging it
past the impedance peak will show the driver resonant frequency and peak
impedance. Our Rmax = 54.93 ohms and our fSA = 40.8
Hz.
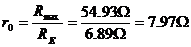
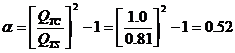
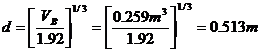
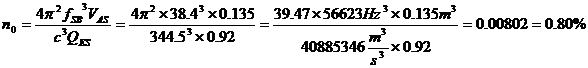
21. Calculate r0 using the following
equation.
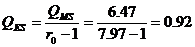
21. Calculate Rx using the following equation. Use the
markers to find the frequencies f1 and f2 on the
impedance curve (above and below fSA) that corresponds exactly
to the impedance value of RX. Our frequencies are f1
= 32.9Hz and f2 = 50.7Hz respectively.

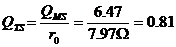
22. Check that the square roots of the product of the
frequencies (f1 and f2) are within 1 Hz of the measured fSA.
Use the following equation.

23. Now calculate the mechanical Q of the driver at
its free air resonant frequency (QMS) as follows:

24. Now calculate the electrical Q of the driver at
its free air resonant frequency (QES) as follows:
25. Now calculate the total Q of the driver at its
free air resonant frequency (QTS) as follows:
Below is a table showing the measured
and calculated Thiele/Small parameters using two methods. First the
constant current method above (column 2) and second the voltage divider
method (see setup in Figure 8) using three different values of
reference resistance (columns 3 to 5). They are 10.07Ω, 100.77Ω
and 994.43Ω respectively. When using the Voltage Divider method
accuracy depends strongly upon the assumption that RREF is much
larger than the driver impedance. As can be seen from Table 1 the
measured value of the driver peak impedance at its resonant frequency (Rmax)
decreases as the value of RREF increases. Hence the
calculated values of QMS, QES and QT (which
are inversely proportional to RMAX) will decrease as RREF
increases.
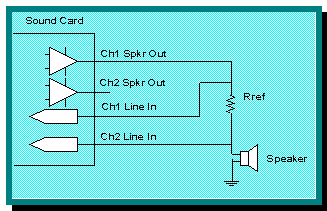
Figure 8: Thiele/Small Extraction Process Voltage Divider
Method Test Wiring
|
Reference
Resistor
|
10.067Ω
Const.
Current
|
10.07Ω
Voltage
Divider
|
100.77Ω
Voltage
Divider
|
994.43Ω
Voltage
Divider
|
|
fSA(meas)
|
40.8Hz
|
40.8Hz
|
40.8Hz
|
40.8Hz
|
|
RMAX(meas)
|
54.93Ω
|
62.41Ω
|
55.41Ω
|
54.63Ω
|
|
RE(meas)
|
6.89Ω
|
6.89Ω
|
6.89Ω
|
6.89Ω
|
|
r0(calc)
|
7.97Ω
|
9.05Ω
|
8.04Ω
|
7.93Ω
|
|
RX(calc)
|
19.45Ω
|
20.72Ω
|
19.53Ω
|
19.40Ω
|
|
f1(meas)
|
32.9Hz
|
33.8Hz
|
32.4Hz
|
33.3Hz
|
|
f2(meas)
|
50.7Hz
|
48.7Hz
|
50.7Hz
|
50.0Hz
|
|
QMS(calc)
|
6.47
|
8.23
|
6.32
|
6.87
|
|
QES(calc)
|
0.92
|
1.23
|
0.90
|
0.99
|
|
QTS(calc)
|
0.81
|
0.91
|
0.79
|
0.86
|
Table 1: Thiele/Small Extraction Process Constant Current
Verses Voltage Divider Method Test Results
21. Now add a mass (such as back to back ceramic disk magnets
or blobs of silly putty or talc) symmetrically about the cone apex. This
will lower the drivers resonant frequency by increasing its cone mass.
The resonant frequency of the driver must be lowered by at least 25% in
order for this to work. In our case this would be a reduction of about 10
Hz. Press the Run button on the application toolbar and observe
the trace in the spectrum analyzer. If the resonant frequency is not
lowered by about 25% add more mass and repeat. Never add a mass greater
than the cone mass. Remove the mass and weigh it to 0.1gram accuracy. You
will need a good scale to do this. The total mass of our silly putty is
13.50 grams Note that paper cones may be damaged when removing silly
putty. Notice the response ripples in the curves due to cone interaction
with the added mass. The better distributed the mass the lower amplitude
of the ripples.
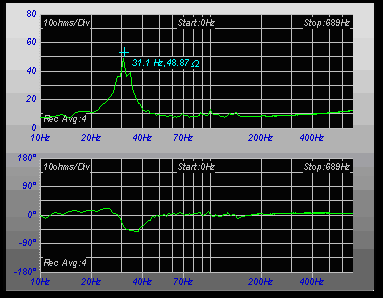
Figure 9: Impedance and Phase Plots of Driver with Added
Mass
22. Find the drivers new resonant frequency on the
added mass impedance curve. Ours is now about 31.1Hz. Then compute the
mechanical mass of the driver cone assembly (including air load) (MMS
in kilograms) as follows:

23. The mechanical compliance of a drivers suspension
is the inverse of how much force (Force = mass x acceleration) it takes
to push the cone per unit distance (per meter). The lower the compliance
the harder it is to push the cone back into the drivers’ magnetic
assembly. Compliance is inversely proportional to drivers’ cone mass and
it free air resonant frequency. This makes sense because the greater a
given mass, the lower its resonant frequency and the harder it is to push
around. Compute the drivers mechanical compliance (CMS) as
follows:

30. Measure the driver cone effective surface area (SD
in meters2). Measure the diameter of the driver cone including
one half of the surround. Ours is a 10” driver so our effective diameter
is about 8.25”. Thus our radius (effective diameter / 2) is 4.125”.
Converting to metric we get 4.125” x 1m / 39.37” = 0.105m. Thus:

29. The free air resonant frequency of a driver is
inversely proportional to the square root of its compliance and its total
mass. This mass includes the mass of the cone, the voice coil assembly,
the dust cap and about half of the surround and spider. The surrounding
air has mass as well and so it exerts a pressure on the cone. This lowers
the resonant frequency. The mass is proportional to air density (p =
1.18kg/m3 @ 20C @ sea level) and the radius of the cone (0.105m). It
ranges from 0.001kg for a 3" driver to about 0.027kg for an 18"
driver. When the driver is suspended in free air this effective
mass (MM1) can be calculated as follows.

30. The mass of the driver cone assembly(MMD)
excluding air load is:

31. We can now check the free air driver resonant
frequency (fSA). The result is very close to our measured
value of 40.8Hz.
32. A driver in an enclosed box is a piston pushing
against a volume of compressible air. The larger the cone and the smaller
the air volume the harder it is for the cone to move back and forth
against the enclosed volume of air. The enclosed volume of air that has
the same stiffness as the driver’s suspension system when compressed by a
piston the same diameter as the driver cone is known as VAS.
It is usually measured in manufacturer’s data sheets as liters of air at
standard temperature (20C) and pressure (sea level). However 1 liter of
air at standard temperature and pressure occupies 1000 liters The volume
of air having the same acoustic compliance as the driver suspension (VAS
in meters3) is calculated as follows:

where: p = the density of air (1.18 kg/m3 at
20°C @ sea level)
and: c = speed of sound (344.5 m/s at 20°C @ sea level)
33. From these basic parameters we can determine an
enclosure type (baffle, closed or vented box). Calculating the drivers
Efficiency Band-width Product (EBP) will give us an idea of the type of
enclosure to design. If the EBP is less than 50 a sealed enclosure might
be more suitable. If greater a vented enclosure should be designed. As
can be seen our driver should go into a closed box.

34. When a driver is placed in a closed box it behaves
like another driver with a heavier cone and a stiffer suspension. Its
resonant frequency is lowered and its Q is raised. In order to calculate
the driver Bl product (Bl), efficiency (n0) and power
sensitivity (Sp) we need to know a little about the intended enclosure.
Calculation of these parameters requires that we know the resonant
frequency of the driver (fSB) when it is mounted in the
enclosure. We will design a sealed enclosure for the driver with a total
system QTC of 1.0. This system will have warm robust lower
end. The system response will be boosted by about 1.25 dB near the
cut-off frequency. First we calculate system alpha as follows:
35. The estimated system resonance may be calculated
as follows:

36. The required box volume may be calculated as
follows:
37. In order to calculate the resonant frequency of
the driver (fSB) when it is mounted in the enclosure we need
to know the mass reactance loading on both the front and rear of the
cone. To calculate the mass reactance loading for the front of the driver
cone (MMR[front]) in a box less than 8ft3:

38. The equation for the effective mass loading on the
rear of the cone is

39. To solve this equation we need to know the value
of Km For rectangular baffles Km approximately
equals:

40. To solve this equation we need to know the value
of B. B is the ratio of the cone area (SD) to the front baffle
area (height x width). We will design a rectangular box with side
dimensions (height, width and depth) in the ratio of 1.6:1.2:1. Thus to
calculate the depth of the box from which all other dimensions can be
derived from:


41. Thus the ratio (B) of the cone area (SD)
to the front baffle area (h x w).
 
40. So Km equates to:

30. So the effective mass, reactance loading on the
rear of the cone (MMR[rear]) is:

31. In order to find the mechanical mass of the driver
excluding air load (MMD) we subtract the mass, reactance loading
of the drivers piston mounted in free air (MM1) from the total
mass, reactance of the driver cone assembly including air load (MMS)

41. Now we add the mechanical mass of the driver
excluding air load (MMD) plus the mass, reactance loading for
the front of the driver cone (MMR[front]) plus the effective
mass, reactance loading on the rear of the cone (MMR[rear]) to
get the mechanical mass of the driver cone assembly excluding air load
(M'MS) when it is mounted in the box.

42. Now we can find the resonant frequency (fSB)
and Q (QTB) of the driver mounted in the enclosure. Notice
that the driver resonant frequency is lowered (from fSA = 40.8
Hz to fSB = 38.4 Hz) and its Q is raised (from QTS
= 0.81 to QTB = 0.86), just as predicted.


43. The Bl product is a measure of the driver motor
strength. It is equal to the field strength of the driver magnet
multiplied by the length of the voice coil wire in the field. Large,
heavy cones with large excursion requirements (Xmax) need
strong motor systems to control harmonic distortion. As more of the voice
coil moves out of the pole piece gap it takes more electrical energy to
move the cone a given distance. From the corrected resonant frequency (fSB)
the Bl product (Bl) of the 10” low frequency driver may be calculated as
follows:

44. Efficiency defines how much acoustic power per electrical
watt of input the driver can produce. It is used to match components in
multi driver systems. Then also from the corrected resonant frequency (fSB)
the half plane, mid-band efficiency (n0) (full-space
efficiency is 3dB less) of the 10” low frequency driver may be calculated
as follows:
45. Reference power sensitivity is the sound pressure level
produced by the driver when mounted on a large baffle at 1 meter with an
electrical input of 1 Watt. From the corrected mid-band efficiency (n0)
the power sensitivity of the 10” low frequency driver can be calculated
as follows:

|